
Ok, having just written a blog post on stats and visualization, I’m going recursive here, and posting a Cirrus word cloud visualization of my blog page (prior to this post):
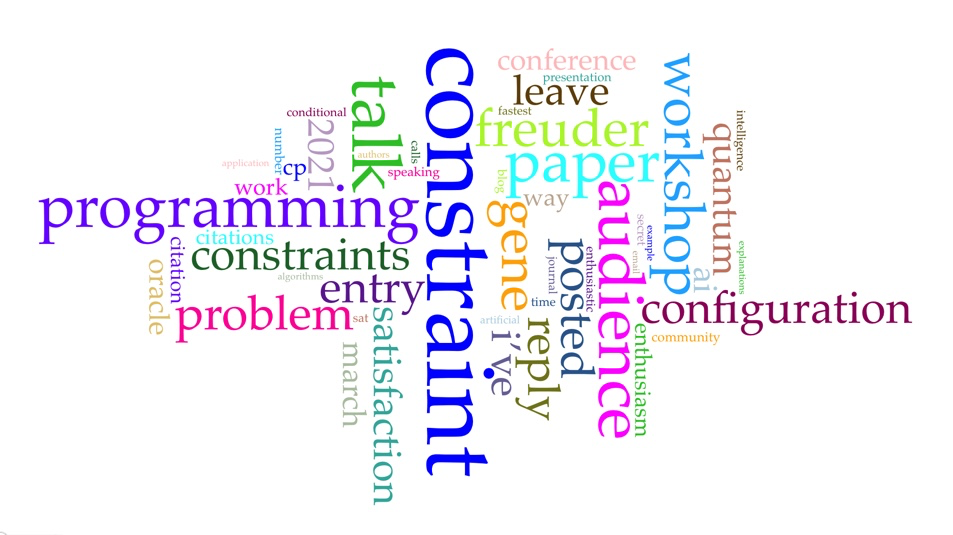
I did this with Voyant Tools, which provide all kinds of textual analysis. For example, when I feed it the CP2021 URL it tells me that “Montpellier” has a .6666667 correlation with “October” with a significance of 0.035265204. Well, perhaps not the best example. 🙂 Let’s go back to word clouds again with the list of accepted papers for CP 2020:
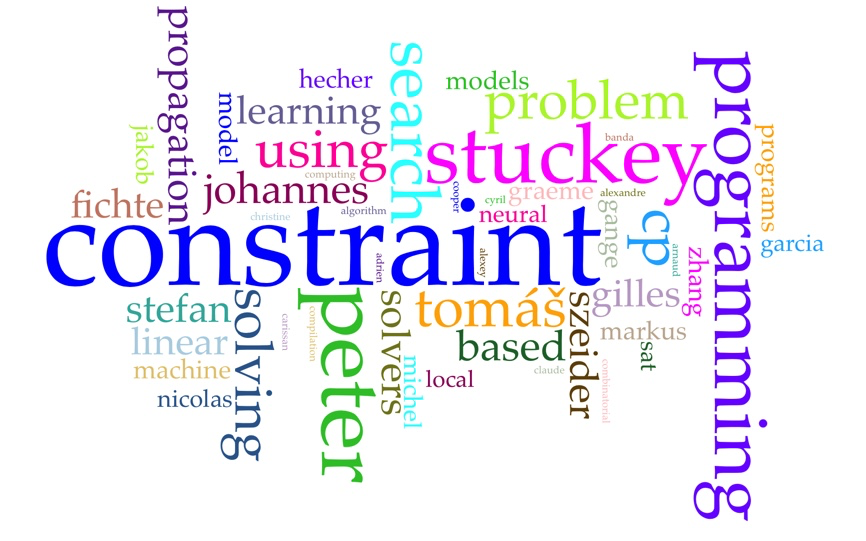
(which, for a small fee, I can make available to Professor Stuckey, suitable for framing).
Compare with a word cloud for the accepted papers at CP 2010:
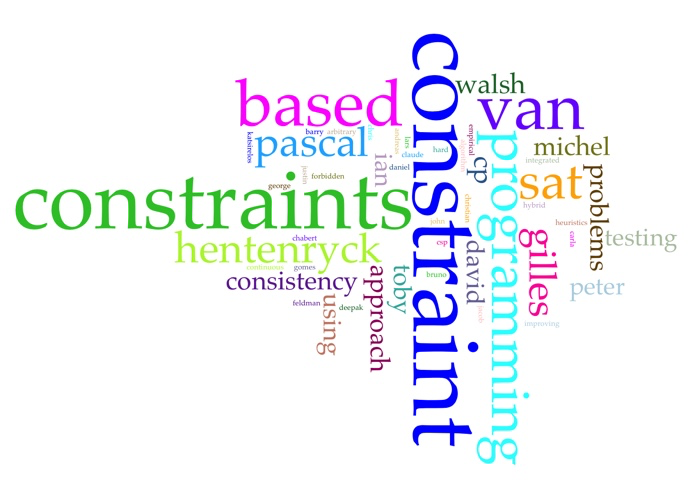
“Learning” doesn’t appear in 2010, but is fairly prominent in 2020. (It may have helped that the call for papers included a thematic track on “CP, Data science and Machine Learning”.) I think there are some other interesting differences, but I’ll leave that as an exercise for the reader — you can post answers in the comments (“reply”). Of course, these word clouds are only snapshots; it would be interesting to visualize trending terms over the full span of the conference. Are there any potential Hans Roslings among us?
